

using data to re-generate and expand the local economy


![]()

![]()
TDX economic analyser application helps local authorities to improve decision making to re-generate and expand the local economy. Using data analysis and forecasting the application improves understanding to help plan and manage the local economy. Intelligent analysis of business rates data and other key variables, combining multiple data sources, including GIS and companies house, provides a rich context around the underlying rates data. The economic analyser has been developed hand in hand with local authorities to increase revenue, improve the environment and deliver a better quality of life to citizens.
core benefits

Secure
Our technology uses state-of-the-art digital certificate-based security to give organisations the confidence and assurance they need to share data.

Privacy
Fine grained permission levels ensure only the right people access sensitive information.

Smarter planning
Understand the health of the local economy, the impact over time of different measures, and analyse data in a geographical context.

Resilience
Identify risks and threats to economic health. Mitigate the potential damage of over reliance and struggling sectors.
features

The data import module enables diverse data sources to be uploaded into a standardised format, by taking imports from either an API or CSV/Excel export. The frequency of the data points available in the system can be increased to give a more accurate view of the economy over time. To provide a context rich tool for exploration of data, the data reconciliation module matches properties for which rates have been collected against company profiles in Companies House data. The final stage of the data reconciliation module involves geocoding properties so that they can be analysed in a geographical context.
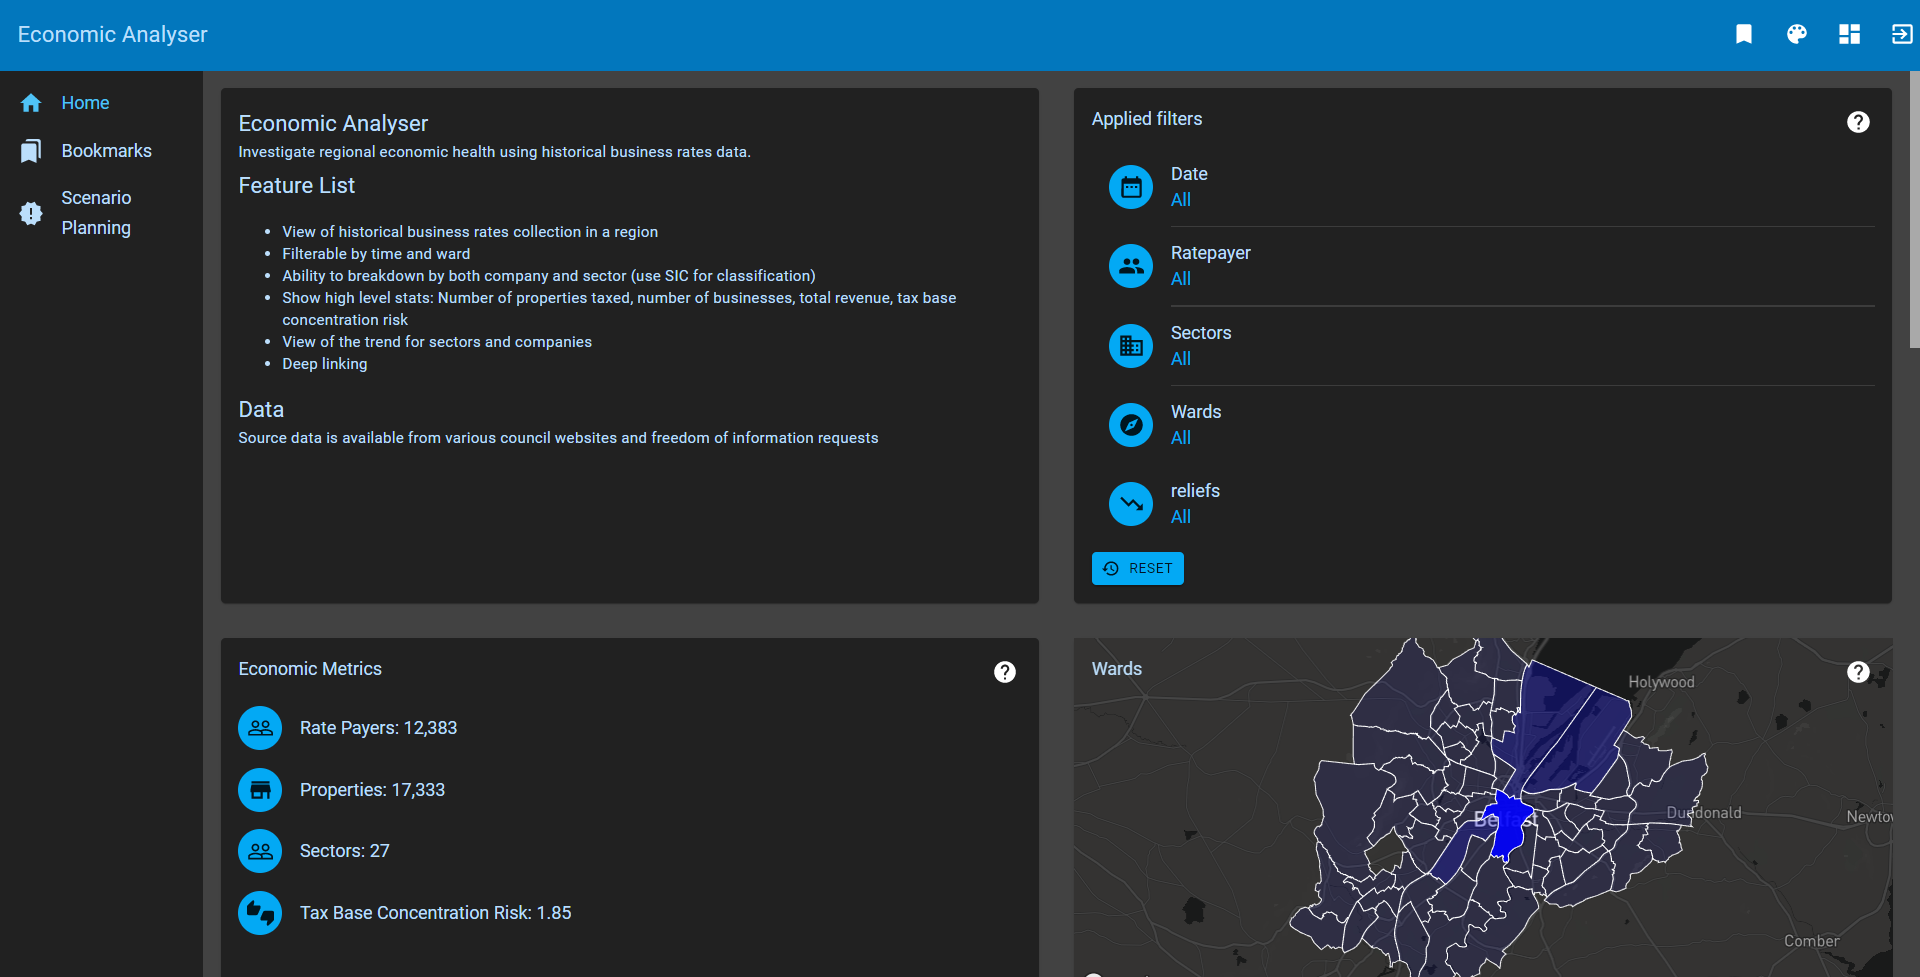
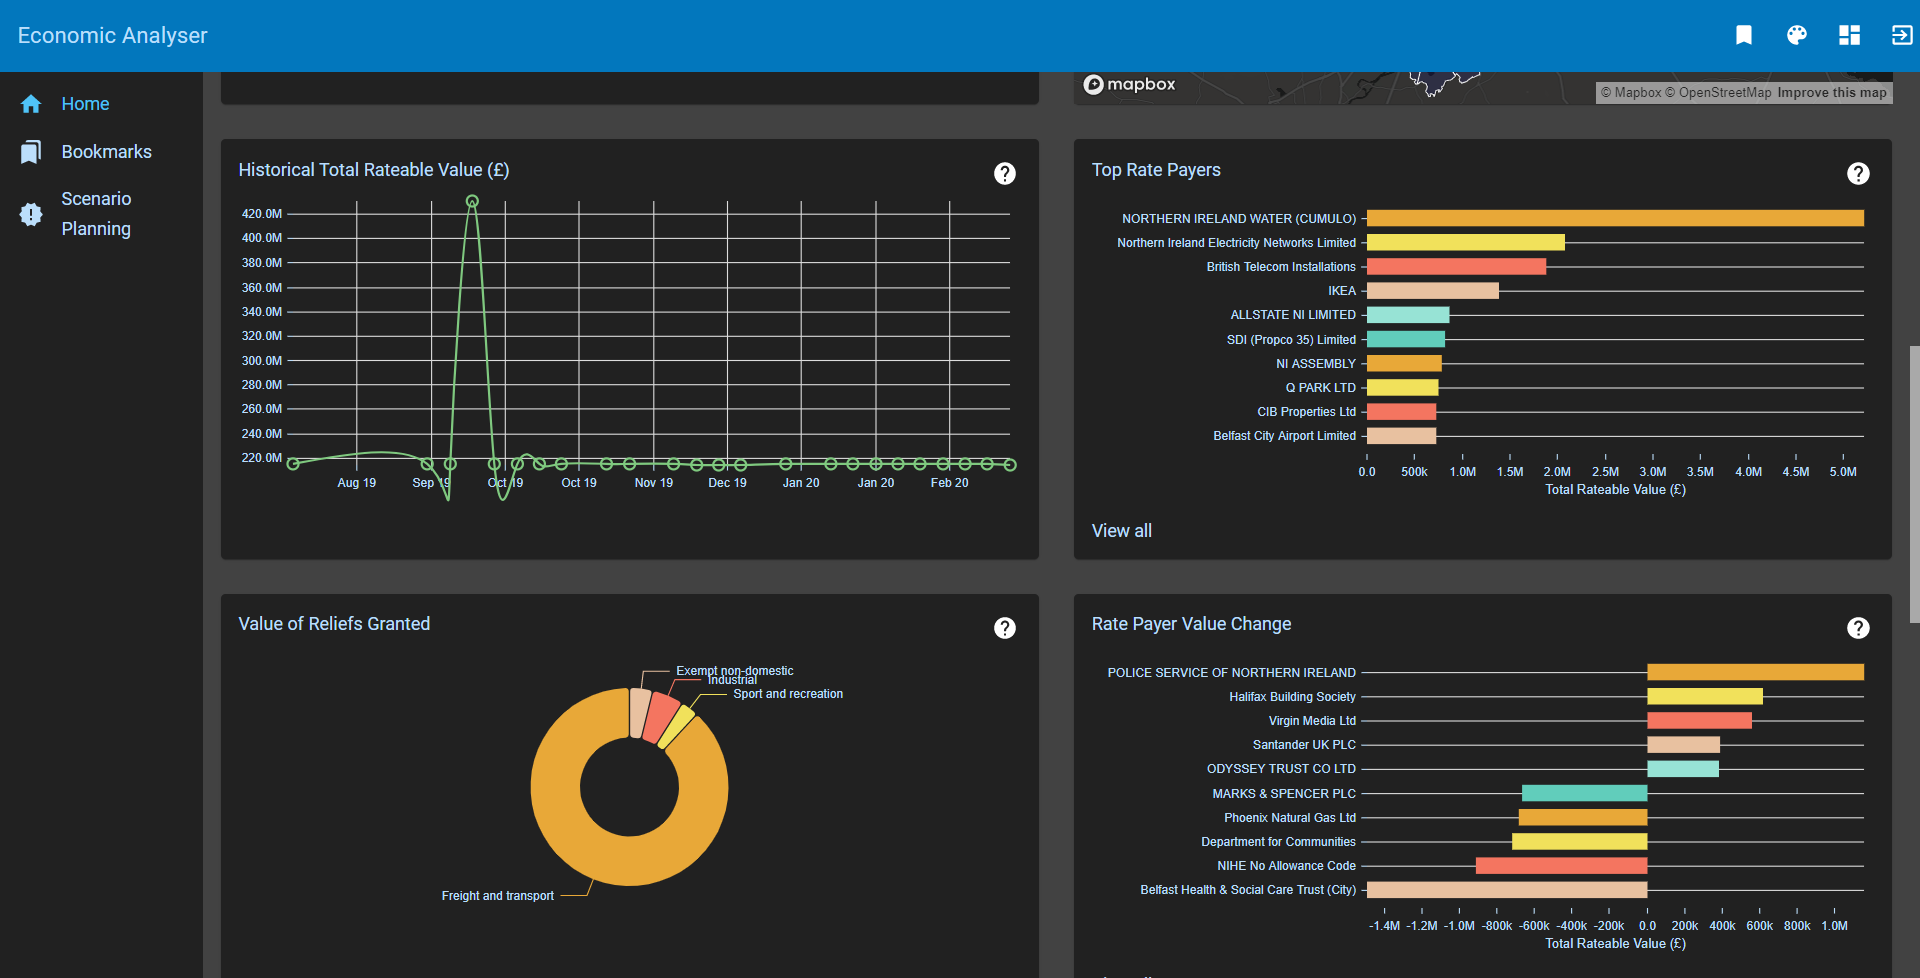
The data visualisation module provides an easy to use, filterable view of business rates collected over time. It allows sub-setting the data across a broad range of parameters including sector, ward, and relief.

The scenario planner displays visually in both GIS and tabular format the state of properties in the selected timeframe: past, present, and future. We forecast the future state using the transition probabilities derived from the data. The transition probabilities can be amended by changing the occupied to unoccupied ratio, as well as the likelihood of transitioning between specific uses.