using data to manage and predict social care pressures


![]()

TDX care analytics assists in the strategic management and planning of social care provision and ensures that it is optimised for service users within the constraints of local authority capacity. It provides robust and easy-to-use tools to import, clean and merge data from a variety of sources and uses Artificial Intelligence (AI) to provide strategic and operational insights, to perform impact analysis and to make recommendations in relation to service provision.
core benefits

Secure
Our technology uses state-of-the-art digital certificate-based security to give organisations the confidence and assurance they need to share data.

Privacy
Fine grained permission levels ensure only the right people access sensitive information.

Smarter Planning
Tools to help plan capital and service investments reduce the costs and risks that are associated with both the over- and under-provisioning of services.

Resilience
Impact analysis is used to improve resilience and perform contingency planning, reducing the effects of emergency measures on cost and quality.

Service Optimisation
Optimising the configuration of care services and travel routes reduces the cost of care provision, improves operational efficiency and reduces CO2 emissions.

Better Outcomes
Optimising care package recommendations based on empirical outcome data, to improve the outcomes for service users and reduce the long-term cost of service provision.

Increased Carer Pool
By recommending walkable routes, the pool of carers can be expanded to include non-drivers. Reducing CO2 footprints and improving community cohesion.

Intervention Impact
Analysis of interventions over time to develop more effective care packages, leading to better outcomes and lower costs.
features

status view
The status view provides high-level analytics based on health and social care data.
- Granularity: Views based on how individual case histories change over time.
- Real-time: Connected to live data sources giving a precise live view of the current situation or updated less often if preferred.
- Dynamic cohorts: Sub-cohorts can easily be created in any view, making it easy to drill down and perform detailed context-specific analysis.
- Advanced cohort definitions: Cohorts can be based on advanced combinations of the attributes of individuals as well as functions of them.
- Integrated data: Providing information from multiple data sources.
- Flow analysis: Model flows through the social care system (e.g. contact, referral, assessment, and commissioning).


Many local authorities collect information on the wellbeing outcomes of their service users; however, the information is rarely analysed at scale and across multiple users. By performing long term analysis across a cohort of users, it is possible to infer the effectiveness of a care service, not just in terms of financial cost, but also in terms of the impact on the wellbeing of a service user. This enables a much more nuanced understanding of the quality of care being delivered.


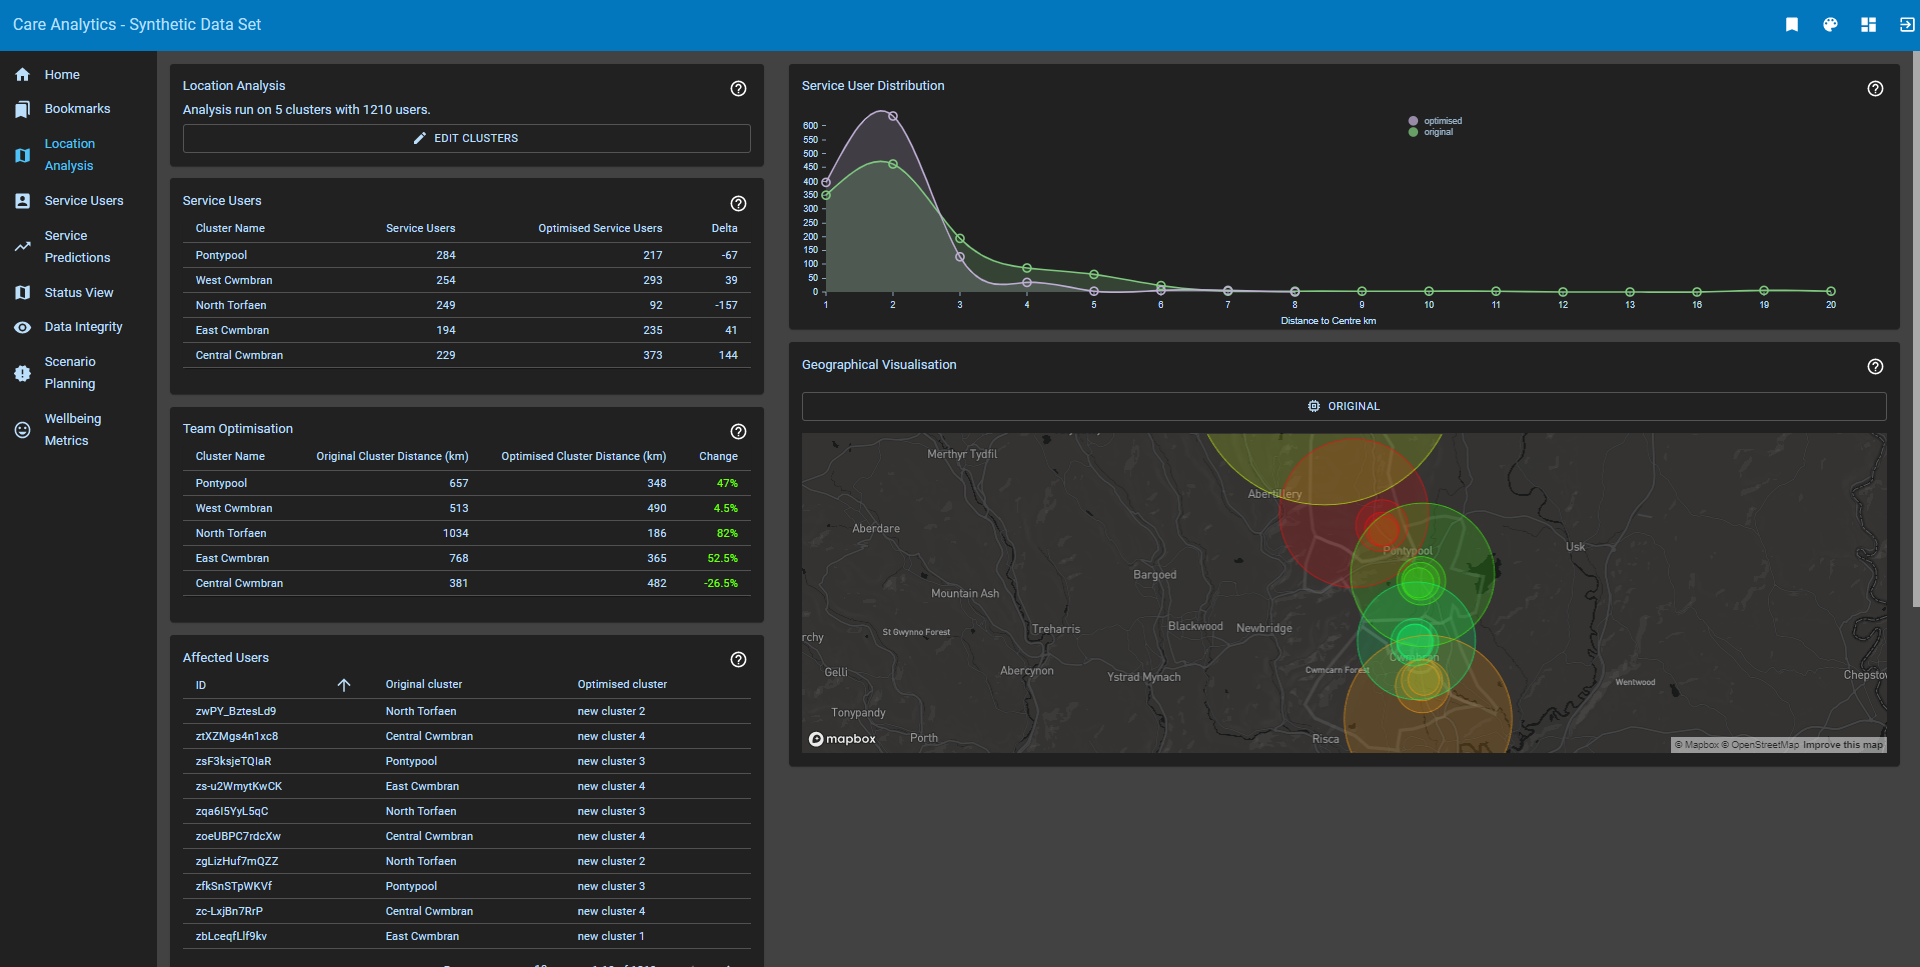
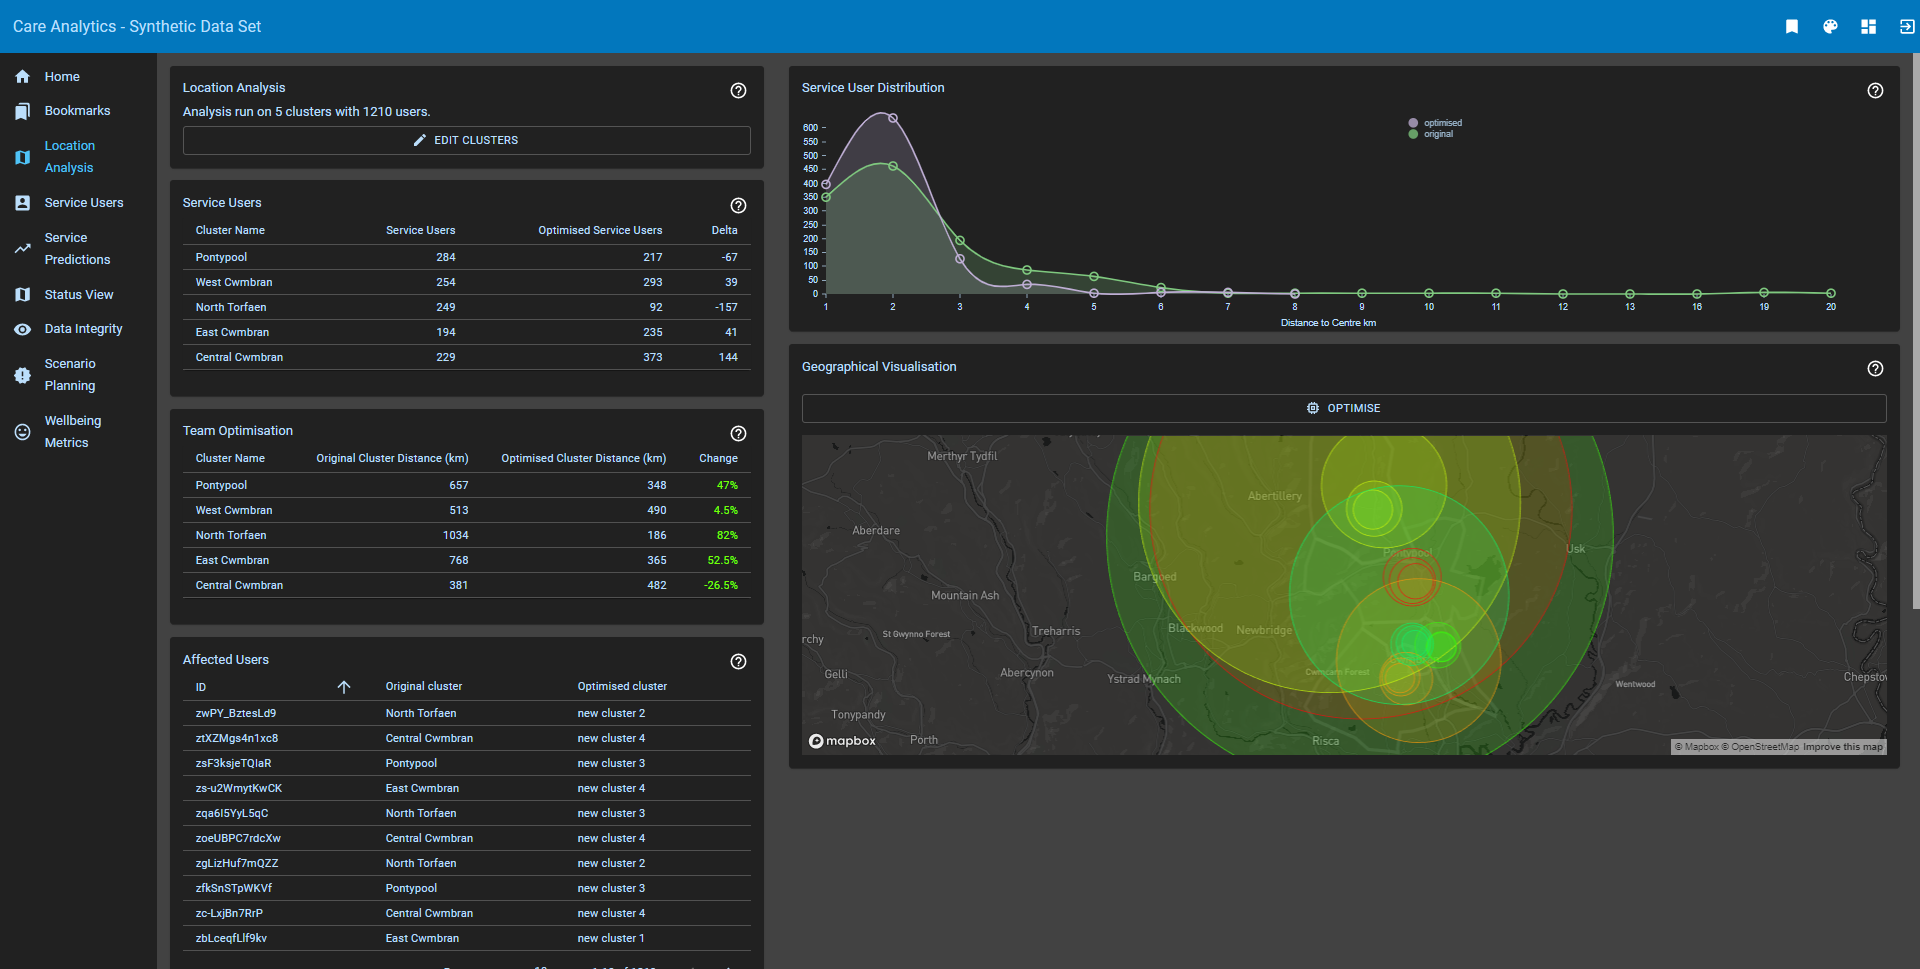
In the location analysis view, it is possible to see the geographical efficiency with which services are supplied to users in terms of travel time, travel cost and distance, and to use AI to optimally allocate service users to service providers and patch teams.